In a recent Learning Solutions article titled “Why Instructional Design Matters in eLearning”, Jackie Booth does a great job of presenting four questions that are essential to the design of successful instructional experiences.
These questions address core considerations that have major influences on experiences that occur within any learning environment.
- Who are the learners, and what are their specific characteristics?
- What knowledge or skills should the learner know or demonstrate at the conclusion of the program?
- What is the best method of presenting the information to achieve maximum learning?
- How best can the program be evaluated as meeting its goals?
In this four-part blog series, I explore each of these questions and offer thoughts on how visual modeling can accelerate answering these questions.
Who are the learners, and what are their specific characteristics?
Knowing the learner(audience) is one of the most basic and often misguided or forgotten tasks in many instructional design projects? Demographic characteristics of learners provide a window into who the learners are, but there is more.
What experiences are learners bringing to the environment, and what is it like to be a learner in the environment?
These questions are not easily answered.
Some designers use questionnaires, interviews, or other research techniques. This data can reveal important insights into information about learners. Yet, effective design is often based on empathy.
How do we place ourselves in the shoes of the learner so we can relate to their ideas, frustrations, goals, and experiences on a deeper level?
In other words, how do we move beyond insights to empathy?
Empathy is at the foundation of good learning environment design. In the following section, I’ll demonstrate one way to visualize empathy-related information to inform the design of learning environments.
The Learner Experience Map
One way to relate to learners is to create a visual map of their characteristics. This information can be gathered from multiple sources including interviews, questionnaires, or general demographic data. The purpose is to not only collect the data, but to create a picture of characteristics and categories of learners.
Visualization increases the insights, use, and design applications from this information.
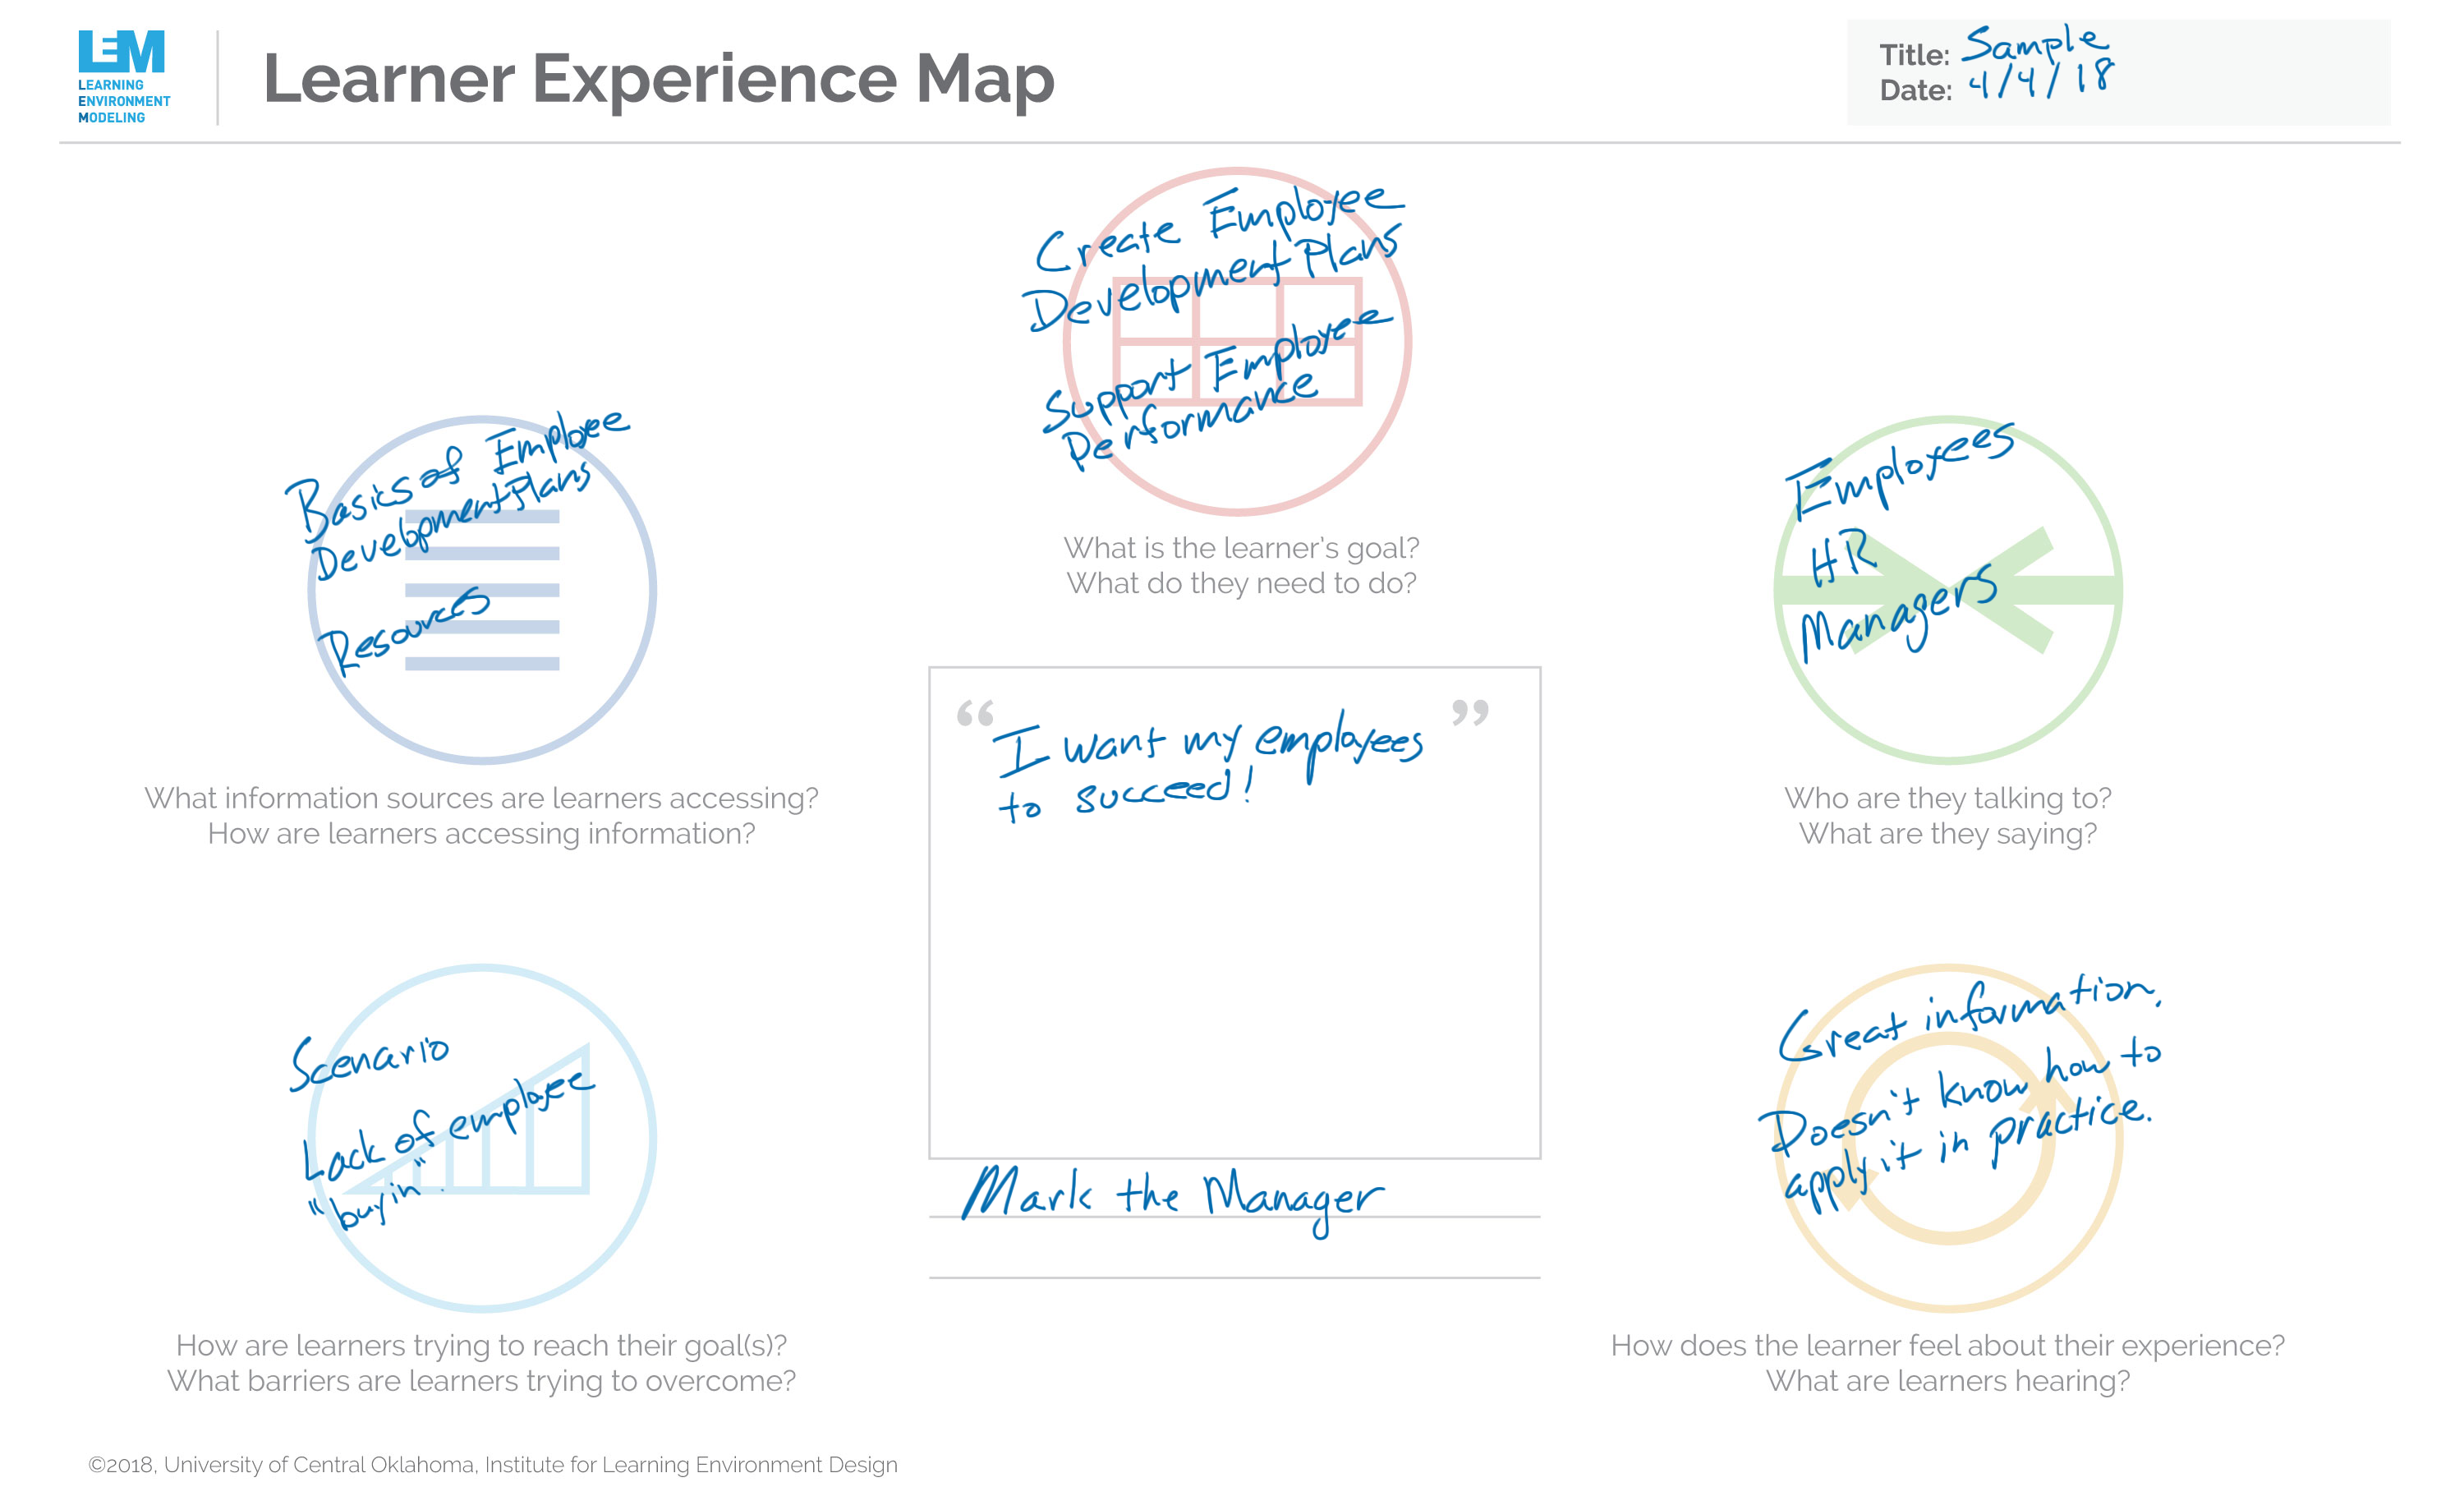
In this example, the Learner Experience Map is used to organize information about learners using the Learning Environment Modeling™ Language. Information can be written on the map or placed using sticky notes. Visualizing information in this way provides a more compete and actionable tool for design. Multiple maps can be used to describe different categories of learners. These can then be compared, organized, and leveraged to support learning environment design decisions.
Summary
Knowing who learners are and their characteristics are essential to the effective design of learning environments. Representing this information in visual ways can support understanding and empathy for learners and their experiences.
The next post of this series focuses on organizing the knowledge or skills learners should know or demonstrate. Aligning learning experiences to desired outcomes remains challenging for many designers, especially in workplace and professional learning contexts.
For more information and resources…
For more information and resources on using visualization to support instructional design, visit http://iled.uco.edu.